High Yield Bonds - History Shows that Reaching for Yield Can Lead to Disaster
By Dave Martin
June 27, 2022

Successful investing in high yield bonds requires great market timing, an appetite for equity-like risk, and a good deal of luck. These three characteristics are the exact opposite of what late-career and in-retirement investors want when they employ bond strategies. They make high yield bond investing more equivalent to risky, high-dividend-paying equities. Reaching for income in high yield bonds is little different than ignoring the warning sign and ascending the top step of a ladder to get something just out of reach. Much of the time it works, you may not get hurt today, but history shows it is only a matter of time before you do.
The temptation is understandable: high yield bonds have offered an average of 566 basis points of option-adjusted spread (OAS) above US Treasury yields since the 1980s. They typically have a shorter duration than investment grade bonds, they are widely available in ETFs, and often high yield issuers are companies that have fallen on temporary hard times but are still credit worthy. All an investor needs to do is reach up, stomach that extra credit risk, and clip that juicy coupon. What could go wrong? Plenty, as history shows us.
High Yield Bonds Tend to Behave Like Equities, Especially in Bad Markets
Since 1983, the Bloomberg US Corporate High Yield Total Return Index has a 0.61 correlation with the S&P 500 Index (total return). High yield bond allocations have a higher correlation to equities when the S&P 500 sells off: of nine major stock market sell-offs since 1983, the high yield index posted negative total returns nine times and double-digit negative total returns five times (see Table 1). In two instances (1983-1984 and 1990), the high yield index lost as much or more than the S&P 500.
| Dates of Drawdown | S&P 500 Index (Total Return) | Bloomberg US Corporate High Yield Total Return Index | Correlation Coefficient During Drawdown Period |
|---|---|---|---|
| November 1983 - May 1984 | -7% | -7% | <0.01 |
| August 1987 - November 1987 | -30% | -7% | 0.36 |
| July 1990 - October 1990 | -15% | -17% | 0.56 |
| June 1998 - August 1998 | -15% | -6% | 0.72 |
| August 2000 - September 2000 | -45% | -12% | 0.55 |
| October 2007 - February 2009 | -51% | -33% | 0.73 |
| September 2018 - December 2018 | -14% | -5% | 0.81 |
| January 2020 - March 2020 | -20% | -13% | 0.83 |
| December 2021 - ??? | -13% | -10% | 0.86 |
Benefiting from the High Yield Risk Premium Requires Prescient Market Timing
Investors may think the increased risk of high yield bonds is duly rewarded by a yield premium. What many investors do not consider is spread volatility over this time and the need for incredibly good market timing to consistently benefit from investing in high yield bonds. Figure 1 below shows high yield spreads over the last four decades. The red boxes outline periods where high yield bonds sold off quickly, increasing spreads. It is unlikely that any investor would have been able to avoid the selloffs, or better yet perfectly time the peaks in yield to buy in and ride the ensuing price appreciation. Even in a long-term buy and hold strategy, the longest fortunate run would have been about seven years between major selloffs.
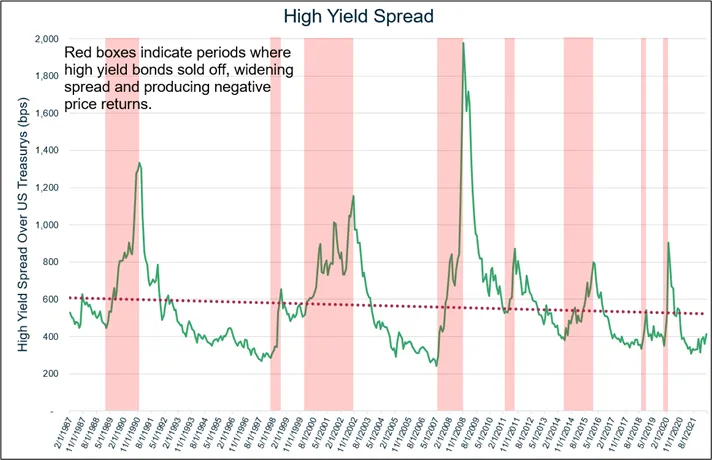
Figure 1: High Yield Spread Over Treasuries. Source: Bloomberg (data as of May 17th, 2022). Information is subject to change and is not a guarantee of future results.
Underlying this boom-and-bust cycle of high yield bonds are periods of relative calm in defaults followed by dramatic surges. Investment grade bonds have defaulted at an average rate of 0.09% since 1981, with a standard deviation of 0.11. In 18 of the last 41 years, no IG bonds defaulted (this is logical as most defaults happen after a downgrade from IG to high yield). The story is very different with high yield: in 1991, 2001, and 2009, high yield bonds defaulted at a rate of more than 2.5x their normal rate, in one case hitting double digit default percentages in 1991 (see Figure 2 below). Looking at the average high yield default rate of 3.95% and applying a linear mental model across decades could lead an investor to overlook the surges of defaults that hit in major credit crises; a primary driver of price selloffs and widening spreads outlined above.
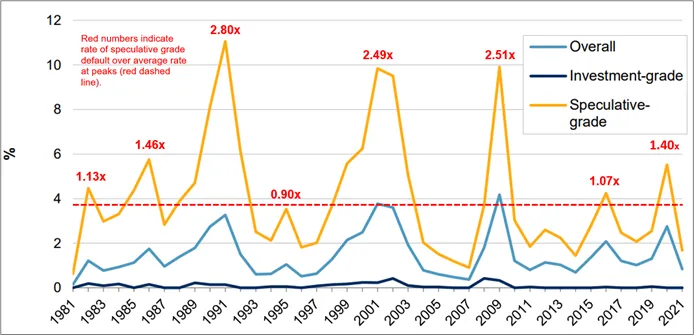
Figure 2: Global Default Rates - Investment Grade vs. Speculative Grade. Source: S&P Global Ratings Research and S&P Global Market Intelligence’s CreditPro®. Copyright © 2022 by Standard & Poor’s Financial Services LLC. All rights reserved. Information is subject to change and is not a guarantee of future results.
Blindly Fixating on Yield Income Masks Poor Long-Term Principal Performance
Putting market timing aside, an investor who bought and held a high yield fund tracking the Bloomberg US Corporate High Yield Total Return Index (LF98TRUU) in May 2012 would have realized a 69.71% total return over the ensuing 10 years (see Figure 3). Seems good, right? But they’d only get that return if they reinvested every dividend payment into more shares of the fund, which defeats the purpose of using high yield bonds for income. If, however, they used the dividends as income and did not reinvest, they would have seen their principal erode by -10.58%. Add to this the downward long-term trend in yields and the rise of inflation, and the investor is hit with a double-whammy: their principal is eroding, and their income stream buys them less every year. (Note, the actual return figure would be lower in a fund due to management fees and other expenses. We use an index for illustrative purposes.)
| Return | 2022 YTD | 1 Year | 5 Years | 10 Years |
|---|---|---|---|---|
| Total Return (All Dividends Reinvested) | -8.37% | -5.84% | 18.41% | 69.71% |
| Price Return (Principal Only) | -10.59% | -10.92% | -12.20% | -10.58% |
We May Have A Bond Strategy That Can Help
We believe late-career and in-retirement investors need to pivot their thinking away from income and towards total return when it comes to bond investing. Since 2018, Build Asset Management has been developing and operating investment strategies that seek to work backwards from the needs of conservative, late-career, and in-retirement investors. These investors need strategies that provide downside risk mitigation while still offering compelling upside potential. We launched our flagship strategy, BUILD Bond Innovation, in January 2020. The strategy is designed to play defense first, and typically has 90% to 95% of its holdings in investment-grade fixed income, with the intent of providing downside risk mitigation over the long term. It seeks to maintain a moderate duration profile and requires investment-grade credit quality in its bond holdings. The strategy invests the remainder of its assets in an actively managed call option overlay tied to the upside performance of the S&P 500.
So how do we do this? The answer lies in the risks of high yield bonds outlined above, and how Build mitigates those risks.
Equity correlation is limited on the downside. BUILD Bond Innovation equity exposure (and correlation) is limited on the downside since we use long only call options on the S&P 500 Index. When the index rises, Build’s strategy participates in the upside. When the Index falls, the maximum loss is the premium Build pays to purchase the option. In cases of extreme stock market losses, such as in the early stages of the COVID-19 pandemic, the Build options position can get compressed to just a fraction of the portfolio, effectively setting a lower bound on equity losses even though stocks can continue selling off.
Market timing not required. BUILD Bond Innovation relies on a rules-based framework to guide when we rebalance or roll equity options positions, which may help minimize the guesswork of market timing needed to be successful in high yield bond investing.
90%+ investment grade fixed income core. Finally, BUILD Bond Innovation uses a fixed income core made up of 90%+ investment grade bonds. We believe the use of investment grade bonds provides two advantages over high yield bonds: 1) reduced correlation to equities and portfolio standard deviation, and 2) default rates are almost nonexistent, which can reduce downside volatility in extreme market events.
If you or your clients are using high yield bonds, we encourage you to consider BUILD Bond Innovation. We will be happy to provide comparison reports of your bond allocation to our strategy. For more information, please email us at info@getbuilding.com, call us at (833) 852-8453, or visit our site at www.GetBuilding.com.