
Figure 1: Two Decades of 401(k) Employee Contribution Increases
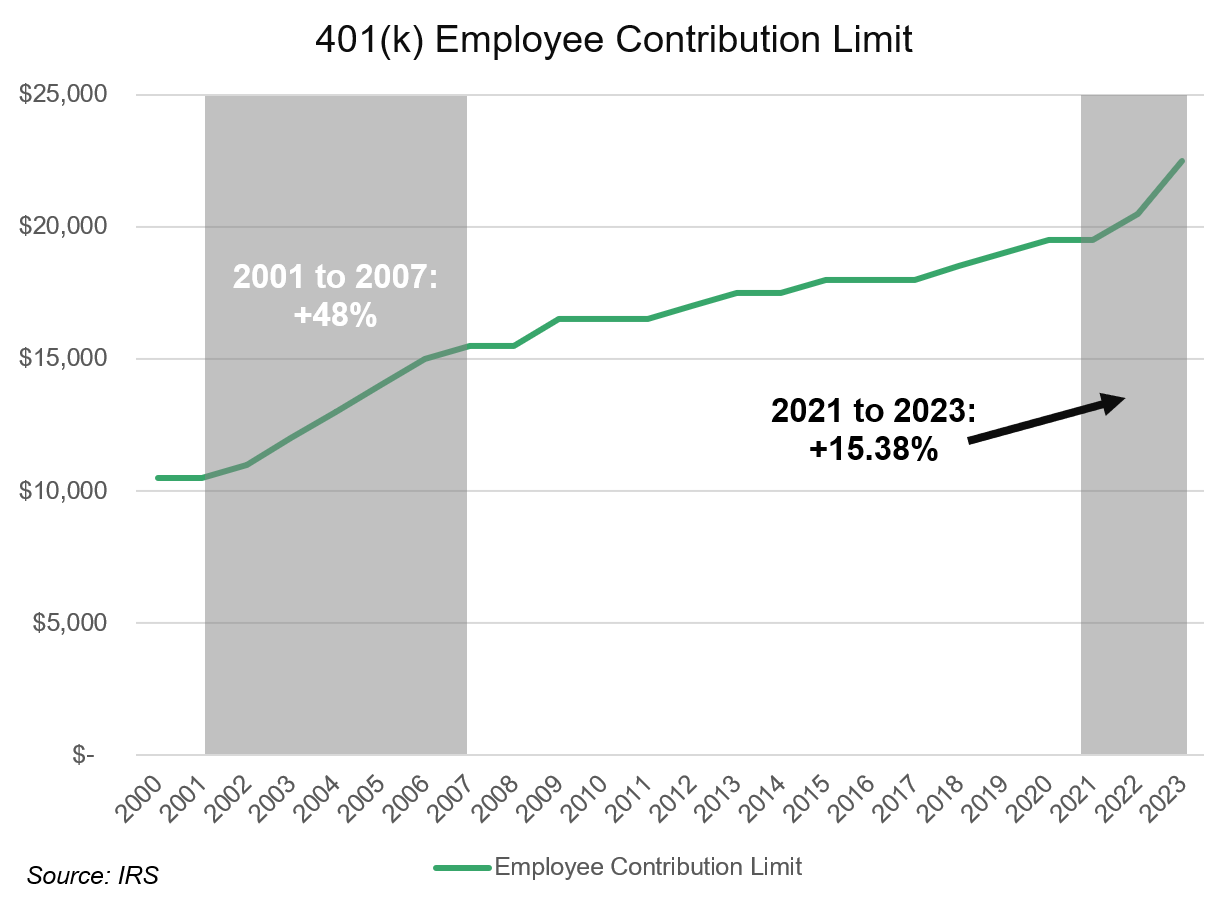
To encourage individuals who are late to the game on saving–or who are just now hitting the point in their careers where they can afford to increase savings rates–the IRS has also boosted the age 50+ “catch-up” contribution limit by 15.38% to $7,500 from $6,500 as well as the compensation limits for calculating contribution limits. A full summary table of contribution types and changes to limits from the prior year is below in Table 1, sourced from the Society for Human Resources Management (SHRM) and the IRS. Of particular note is that individuals over 50 years old can now defer up to $30,000 of their compensation. Assuming an individual started with $0 saved for retirement at age 50, and took full advantage of the $30,000 limit until retirement age, by age 65 they would have stashed away $680,000 for retirement, assuming a somewhat conservative 5% asset compounding rate over that period. Unfortunately, as we’ll see below, very few people either have the means to save at that rate, or have not executed on such a plan.
Table 1: Contribution Changes Summary (Source: SHRM and IRS)
| Type of Contribution | 2023 | 2022 | % Change |
| Maximum employee elective deferral (age 49 or younger) 1 | $22,500 | $20,500 | 9.76% |
| Employee catch-up contribution (age 50 or older by year-end) 2 | $7,500 | $6,500 | 15.38% |
| Maximum employee elective deferral plus catch-up contribution (age 50 or older) | $30,000 | $27,000 | 11.11% |
| Defined contribution maximum limit, employee + employer (age 49 or younger) 3 | $66,000 | $61,000 | 8.20% |
| Defined contribution maximum limit (age 50 or older), all sources + catch-up | $73,500 | $67,500 | 8.89% |
| Employee compensation limit for calculating contributions | $330,000 | $305,000 | 8.20% |
| Key employees’ compensation threshold for top-heavy plan testing 4 | $215,000 | $200,000 | 7.50% |
| Highly compensated employees’ threshold for nondiscrimination testing 5 | $150,000 | $135,000 | 11.11% |
2 The $7,500 catch-up contribution limit for participants age 50 or older applies from the start of the year for those turning 50 at any time during the year.
3 Total contributions from all sources may not exceed 100% of a participant’s compensation.
4 Includes officers of the company sponsoring the plan.
5 For the 2023 plan year, an employee who earned more than $150,000 in 2022 is an HCE.
Despite Limit Increases, Many Americans are Behind on Saving
Incomes, and the ability to defer income into retirement accounts, have a general tendency to increase with age. Unfortunately, despite contribution and catch-up limit increases, the majority of Americans are woefully behind on retirement savings. Only 12% of American retirement savers currently max out their 401(k) contributions, according to US News & World Report and Vanguard (Are Your Retirement Savings Ahead of the Curve?). To be fair, making a $22,500 to $30,000 deferment to your 401(k) every year is a very tall task and this behavior skews to high earners, but savings rates in general are still low. Looking at Table 2 below you see a natural progression in both account balances and savings rates by age bracket. At first glance these rates look encouraging, as plan participants clearly show a habit of increasing savings rates over time. However, the issue with this data is it only accounts for Americans who have access to an employer-sponsored 401(k) plan. According to Newsweek, only 60 million Americans participated in a 401(k) plan in 2021.
Table 2: 401(k) Balances and Savings Rates by Age Group (Source: US News & World Report, Vanguard)
| Age Group | Average 401(k) Account Balance | Average 401(k) Savings Rate |
| < 25 | $6,718 | 5.0% |
| 25 to 34 | $33,272 | 6.3% |
| 35 to 44 | $86,582 | 6.7% |
| 45 to 54 | $161,079 | 7.4% |
| 55 to 64 | $232,379 | 8.7% |
| 65+ | $255,151 | 9.2% |
If You Haven’t Already Started Saving for Retirement, Start Immediately; If You Have Already Started, Save More
Via Federal limit increases, Americans who have access to a tax-deferred retirement savings plan have been given a rare opportunity to accelerate their savings and potentially ensure a better retirement experience. If cost-of-living adjustments remain high like they did between 2001 and 2007, we could see contribution limits continue to increase. We also know that starting an aggressive savings plan late and taking advantage of compounding is far better than having no plan at all. Table 3 provides calculations of age 65 account balances, assuming a 15 year compounding period starting at age 50 and an assumed rate of return. Scraping together $5,000 a year at a 2.50% rate of return will get you $92,000 by age 65, which while not a small fortune is better than nothing. The numbers only go up from there the more aggressive a saver gets and if rates of return trend closer to historical norms over that decade and a half. An individual who contributes $30,000 a year and is lucky to achieve a 15% annual return would have a small fortune of $1.642 million at age 65.
Table 3: Age 65 Account Balance by Annual Contribution and Assumed Average Return, Assuming Starting at Age 50
| Annual Contribution | 2.50% Annual Return | 5.00% Annual Return | 7.50% Annual Return | 10.00% Annual Return | 12.50% Annual Return | 15.00% Annual Return |
| $5,000 | $92,000 | $113,000 | $140,000 | $175,000 | $218,000 | $274,000 |
| $10,000 | $184,000 | $227,000 | $281,000 | $349,000 | $437,000 | $547,000 |
| $15,000 | $276,000 | $340,000 | $421,000 | $524,000 | $655,000 | $821,000 |
| $20,000 | $368,000 | $453,000 | $562,000 | $699,000 | $873,000 | $1,094,000 |
| $25,000 | $460,000 | $566,000 | $702,000 | $874,000 | $1,092,000 | $1,368,000 |
| $30,000 | $551,000 | $680,000 | $842,000 | $1,048,000 | $1,310,000 | $1,642,000 |
Plan advisors and asset managers have a duty to continue to educate and nudge retirement savers across all age groups to do their research and consider increasing their savings rate in these vehicles. The best time to start saving for retirement was yesterday, but the second-best time is today.