
A few months ago a handful of economists were calling the inflation top, and some investors started betting on rate cuts in 2023. Fixed income investors that wagered on a bond rally were rewarded in July for extending duration in their portfolios. Duration is a measure of a bond’s sensitivity to changes in interest rates. Taking on more duration in a portfolio will lead to higher price appreciation if rates move down. However, the opposite is also true, with rate increases leading to bigger price losses as bonds sell off. Bond investors learned this painful lesson in the first half of 2022, with the largest bond drawdown in a generation delivering double-digit punishment almost across the board (see Table 1). After a July 2022 stock and bond rally, followed by another sell-off, some investors may be tempted to “buy the dip” in bonds and take on more duration in hopes that the Fed achieves a swift victory over inflation and can soon pivot to a more dovish posture. But as we’ll see below we may not be out of the woods yet, and it may be wise for investors to proceed with caution.
Table 1: 1H22 Fixed Income Asset Performance
| Index Name | YTD TR (%) | MTD TR (%) | Duration (Y) | YTW (%) | OAS (bps) | YTD ΔOAS (bps) |
| U.S. Aggregate (Bloomberg US Agg Total Return Index) | -10.3 | -4.7 | 6.36 | 3.72 | 55 | +19 |
| Euro-Aggregate (Bloomberg Euro Aggregate Corporate Total Return Index) | -12.1 | -7.1 | 6.83 | 2.09 | 101 | +44 |
| Asian-Pacific Aggregate (Bloomberg Asian-Pacific Aggregate Total Return Index) | 3.2 | 1.7 | 7.74 | 1.76 | 7 | +1 |
| EM USD Aggregate (Bloomberg EM USD Aggregate Total Return Index) | -17.1 | -8.7 | 6.24 | 7.17 | 408 | +88 |
| Corporate (Bloomberg US Corporate Total Return Index) | -14.4 | -7.3 | 7.50 | 4.70 | 156 | +63 |
| U.S. MBS (Bloomberg US MBS Total Return Index) | -8.8 | -4.0 | 5.78 | 3.77 | 46 | +14 |
| U.S. Corporate High Yield (Bloomberg US Corporate High Yield Total Return Index) | -14.2 | -9.8 | 4.23 | 8.89 | 569 | +286 |
| U.S. Treasury (Bloomberg US Treasury Total Return Index) | -9.1 | -3.8 | 6.33 | 3.09 | -1 | -1 |
| U.S. TIPS (Bloomberg US Treasury Inflation Notes TR Index) | -8.9 | -6.1 | 5.07 | 3.38 | 0 | 0 |
Note: Past performance is not indicative of future returns.
US rates markets are at an inflection point: bond investors are trying to position their portfolios for an increasingly likely US recession while a hawkish Fed is raising rates and reducing its balance sheet. In the absence of inflation, recessions are normally viewed as bullish for rate-sensitive fixed income securities. The tools at the Fed’s disposal to fight recessions work by decreasing borrowing costs (i.e., lowering interest rates) to stimulate economic activity. In this “normal” world, an investor could add rate sensitivity to a portfolio by increasing duration to fixed income products that no spread risk, such as US Treasuries[1]. Indeed, we are already seeing this happen; several long duration Treasury ETFs have seen significant inflows since the Fed began raising rates in March 2022 and recession odds started to go up.
However, inflation above 9% puts the proverbial fly in the ointment. The hottest inflation in four decades (see Figure 1) is likely to impact the Fed’s response function to changes in financial conditions. Remember that the same tools that are used to spur growth during a recession are also inflationary, and a sitting Fed chair that greatly admires Paul Volcker is all too wary of the 1970’s stagflation trap.
Figure 1: US CPI Year-Over-Year Change vs. 10 Year US Treasury Yield
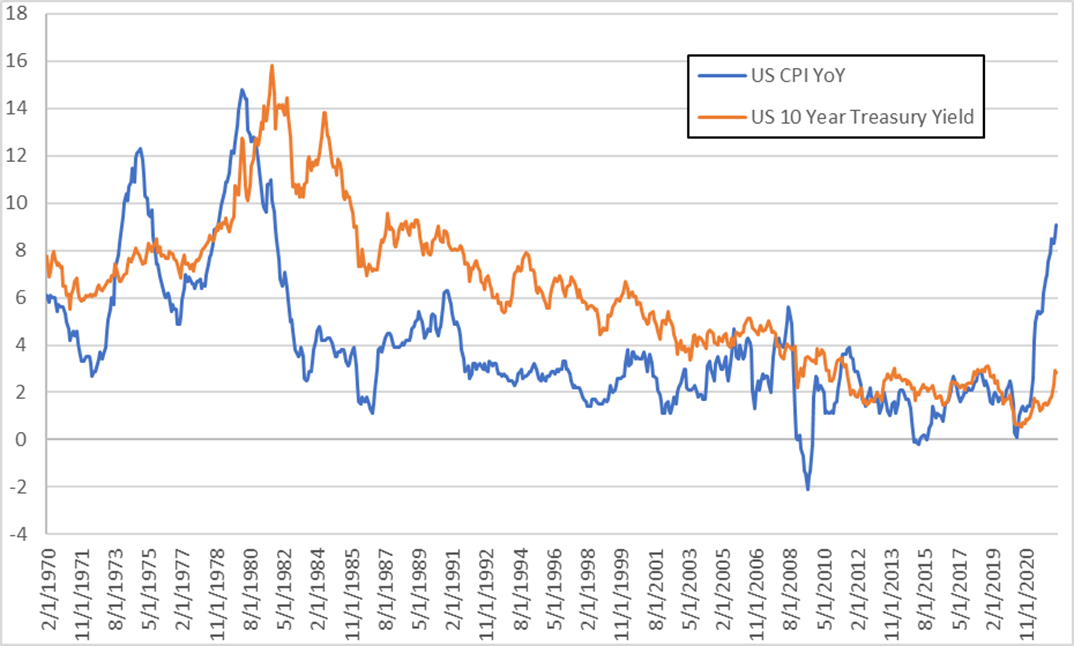
Source: Bloomberg.
The two crucial questions investors looking at the inflation numbers and considering their impact on Fed action are:
- Have we already hit the inflation peak?
- How quickly will it come back down after it peaks, and to what level?
An investor who knows the answers to these questions would have a much better view of when the right time is to consider adding duration to their fixed income portfolio. The challenge is that inflation expectations have not been a good predictor of future realized inflation.
[1] Given the general tendency for spreads to increase with economic uncertainty.
Economists–and Their Models–Have Been Consistently Wrong About Inflation
There’s an old joke that economists have successfully predicted nine out of the last five recessions. Unfortunately, in the opposite vein economists have consistently underestimated the monthly inflation prints. Year to date the CPI survey has underestimated headline CPI by 1 – 3 basis points in 5 out of 7 months, and underestimated PCE in 3 out of 7 months (see Table 2 and Figure 2). July was the first CPI release of the year where economists over-estimated inflation.
Table 2: 2022 US Inflation Prints
| Month | CPI (YoY) | CPI Survey | Diff | PCE (YoY) | PCE Survey | Diff |
| January | 7.5% | 7.3% | +0.2% | 6.0% | 6.4% | -0.4% |
| February | 7.9% | 7.9% | – | 6.4% | 6.4% | – |
| March | 8.5% | 8.4% | +0.1% | 6.5% | 6.6% | -0.1% |
| April | 8.3% | 8.1% | +0.2% | 6.2% | 6.0% | +0.2% |
| May | 8.6% | 8.3% | +0.3% | 6.0% | 5.9% | +0.1% |
| June | 9.1% | 8.8% | +0.3% | 5.9% | 5.7% | +0.2% |
| July | 8.5% | 8.7% | -0.2% | 6.3% | 6.4% | -0.1% |
Source: Bloomberg (data as of August 30th, 2022)
Figure 2: June CPI vs Analyst Survey Expectations
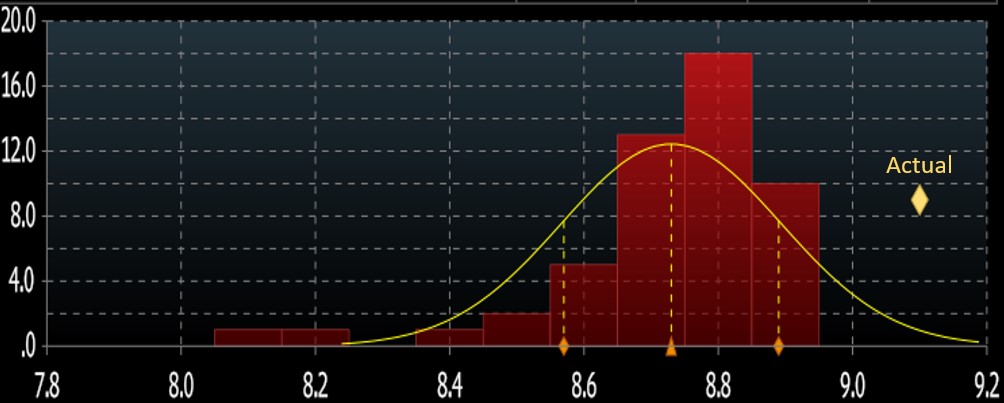
Source: Bloomberg.
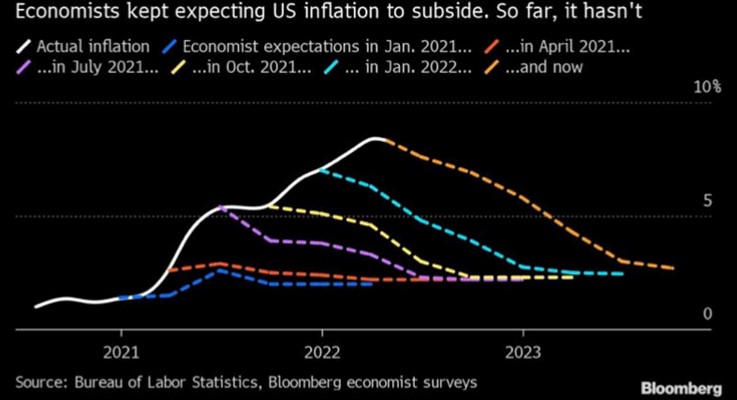
Practitioners of the dismal science have also repeatedly called an inflation top, only to be surprised and re-project their models further out (see Figure 3).
Figure 3: Economist Projections on Peak Inflation
Seeing the obvious track record of human error in survey results, you may turn to the markets for a more objective view into the future. Unfortunately, the view isn’t much better. The market-implied forward inflation rates calculated from the difference between the yield on UST and similar maturity TIPs paint an even rosier picture of the course for inflation (see Table 3). Looking at the 1Y breakeven rate of 4.3%, to get to that low level of rates, inflation would have to begin dropping by 75 bps a month, every month, for the next year to achieve an average value of 4.3% seen in market pricing. The market is pricing in a very rapid pullback in inflation numbers.
Table 3: TIPS / Treasury Breakeven Rates
| Tenor | CPI (YoY) |
| June Print | 9.1% |
| 1 Year | 4.3% |
| 2 Year | 3.3% |
| 3 Year | 2.9% |
| 5 Year | 2.6% |
| 10 Year | 2.3% |
Source: Bloomberg (data as of June 30th, 2022)
However, history shows that inflationary shocks have a tendency to persist, even in the face of an aggressive Fed. In December 1981, CPI was at 8.9%; it took 18 months to get inflation back down to 2.6%, and that was with Fed Funds rates near 10%. While the market-implied inflation may not be unreasonable, there is significantly more room for rates to rise than to fall relative to long term historical values. This asymmetric return profile should be a caution to any investor thinking about extending or being overweight duration for long term capital appreciation at this time.
Inflation and its Consequences
When looking at headline inflation rising at 9.1% and core inflation stable at 5.9% the obvious observation is that these values are significantly outside the Fed’s inflation target. In response, the Fed has hiked rates three times. March saw a +25bp hike, May saw a +50bp hike, and June and July saw +75bps hikes. The Fed is building credibility that they are going to continue raising rates despite concerns about the broader economy. This is currently easier as a strong labor market has meant that the Fed can claim current success for their other key mandate of maximum employment, even while US GDP has contracted two quarters in a row, producing a “technical” recession. Given that increases in unemployment typically show up with a lag to deterioration in the economy, there is little reason to believe that the Fed will be pushed off its hiking stance in the next quarters.
“We understand the hardship high inflation is causing. We are strongly committed to bringing inflation back down and we are moving expeditiously to do so. We have both the tools we need and the resolve it will take to restore price stability on behalf of American families and businesses.”
– Jerome Powell, Fed Chair, U.S. Senate Banking Committee Testimony June 22, 2022
The longer inflation sustains itself, the more likely that buyers of fixed income instruments will balk at the possibility of locking in a negative real yield. If inflation can’t be controlled by the rate hikes that have been priced in, the more rate-sensitive long end of the curve may see upward pressures as the market reprices for additional rate hikes. Further, if the Fed has to find a middle ground in which an above target level of inflation is accepted, then it is unlikely that they will be able to cut rates to 0% as has been the experience in recent memory.
As part of the Fed’s update to its inflation targeting criteria in 2020, Jerome Powell made clear that he was aware of inflation expectations priced into the market but needed to see realized inflation before the committee would move to hike rates. There is a possibility that the Fed will continue this policy of reacting to real data and so one of the following must be satisfied before a potential dovish turn:
- Realized inflation moderates significantly from its June 2022 level of 9.1%
- Financial Markets see significant turmoil to the extent that the Fed has no choice but to stimulate the economy to avoid a depression
Handling Duration Risk in Your Portfolio
There seems to be brewing confidence that the Fed will stomp inflation out quickly and begin the policy rate cutting cycle in the first quarter of 2023. However, as outlined above, we see significant uncertainty driven by three factors:
- Markets and economists have been woefully inaccurate at calling inflation tops
- Fed policy effectiveness has not been tested against this type of inflation in four decades
- There is asymmetric risk that inflation—and the need for higher rates—persists for longer than markets are currently pricing in
Given the uncertainty, it may be prudent for fixed income investors to take a wait-and-see approach as it pertains to extending duration and thus taking more interest rate risk. This is especially true for conservative investors that have a much higher focus on capital preservation.
Note: Build Asset Management manages investment strategies that typically run at a duration short of their benchmarks, as the products are designed to have a drawdown experience similar to investment grade bonds. The presence of equity options means that risk must be cut in the fixed income core to limit exposure to drawdown risk.
We May Have Your Bond Solution
Since 2018, Build Asset Management has been developing and operating investment strategies that work backwards from the needs of conservative, late-career, and in-retirement investors. These investors need strategies that provide downside risk mitigation while still offering compelling upside potential. We launched our flagship strategy, BUILD Bond Innovation, in January 2020. The strategy is designed to play defense first, and typically has 90% to 95% of its holdings in investment-grade fixed income, with the intent of providing downside risk mitigation over the long term. It seeks to maintain a moderate duration profile and requires investment-grade credit quality in its bond holdings. The strategy invests the remainder of its assets in an actively managed call option overlay tied to the upside performance of the S&P 500.
So how do we do this?
Equity correlation is limited on the downside. BUILD Bond Innovation equity exposure (and correlation) is limited on the downside since we use long only call options on the S&P 500 Index. When the index rises, Build’s strategy participates in the upside. When the market falls, the maximum loss is the premium Build pays to purchase the option. In cases of extreme stock market losses, such as in the early stages of the COVID-19 pandemic, the Build options position gets compressed to just a fraction of the portfolio, effectively setting a lower bound on equity losses even though stocks can continue selling off.
Market timing not required. BUILD Bond Innovation relies on a rules-based framework to guide when we rebalance or roll equity options positions, minimizing the guesswork of market timing needed to be successful in high yield bond investing.
90%+ investment grade fixed income core. Finally, BUILD Bond Innovation uses a fixed income core made up of 90%+ investment grade bonds. The use of investment grade bonds provides two advantages: 1) reduced correlation to equities and portfolio standard deviation, and 2) default rates are almost nonexistent, which reduces downside volatility in extreme market events.
If you or your clients have conservative objectives and want a new tool for the current economic environment, we encourage you to consider BUILD Bond Innovation. We will be happy to provide comparison reports of your bond allocation to our strategy. For more information, please email us at info@getbuilding.com, call us at (833) 852-8453, or visit our site at www.GetBuilding.com.
Disclosures and Definitions
Build Asset Management, LLC (a/k/a Build Asset Management and/or GetBuilding.com) is an investment adviser registered with the U.S. Securities and Exchange Commission. Registration of an investment adviser does not imply any skill or training. Build Asset Management does not provide legal or tax advice. Please consult your legal or tax professionals for specific advice. Build Asset Management only transacts business in states in which it is properly registered or is excluded or exempted from registration. A copy of Build Asset Management’s business practices, services, and fees is available through the SEC’s website at: www.adviserinfo.sec.gov.
Build does not guarantee any minimum level of investment performance or the success of any index portfolio, index, mutual fund or investment strategy. Past performance does not guarantee future results. There is a potential for loss in any investment, including loss of principal invested. All investments involve risk, and different types of investments involve varying degrees of risk. Investment recommendations will not always be profitable.
For more information contact us at (833) 852-8453.
IMPORTANT RISK INFORMATION: An investment in any fund involves risk, including possible loss of principal.