
The problem facing investors: interest rates are at historic lows.
For the past four decades, bonds have been on a great run – diversifying portfolios, producing income, and reducing volatility. However, investing in bonds today will in most cases yield you a negative real return. For investors in or near retirement, this presents a quandary: they’ve been taught to de-risk and seek safe and modest returns in retirement, but safe and modest returns have ceased to exist. Absent a significant change in fiscal, monetary, and economic policy, there is not much left for fixed income markets to provide.
To get to the causes and consequences of this environment, we need to explore the “five whys.” We took a deep dive into fixed income markets and macroeconomic trends to step through each of the whys. The answers we found point advisors and their clients to an urgent need to find alternatives to classic fixed income strategies.
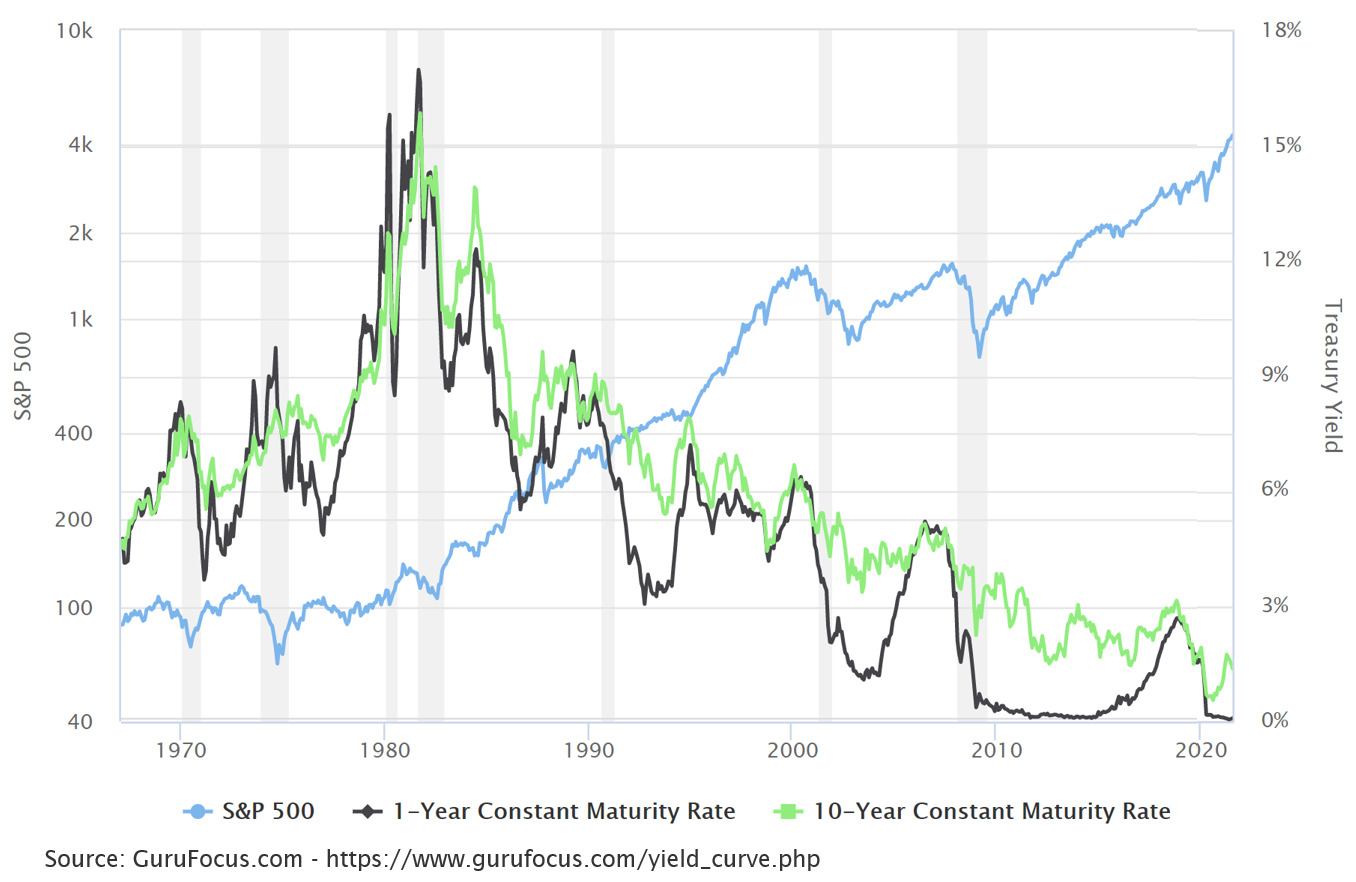
Why #1: Since the early 1980s, the Fed has cyclically cut short-term interest rates to zero. Short periods of increasing rates have oscillated around a clear downward trend.
Figure 1: S&P 500 Index vs Treasury Yields
Why #2: The US economy requires increasingly more credit creation to sustain its economic growth (%ΔGDP). This is a self-perpetuating cycle that feeds upon itself.
Figure 2: Growth in Nominal GDP vs Total Credit Outstanding
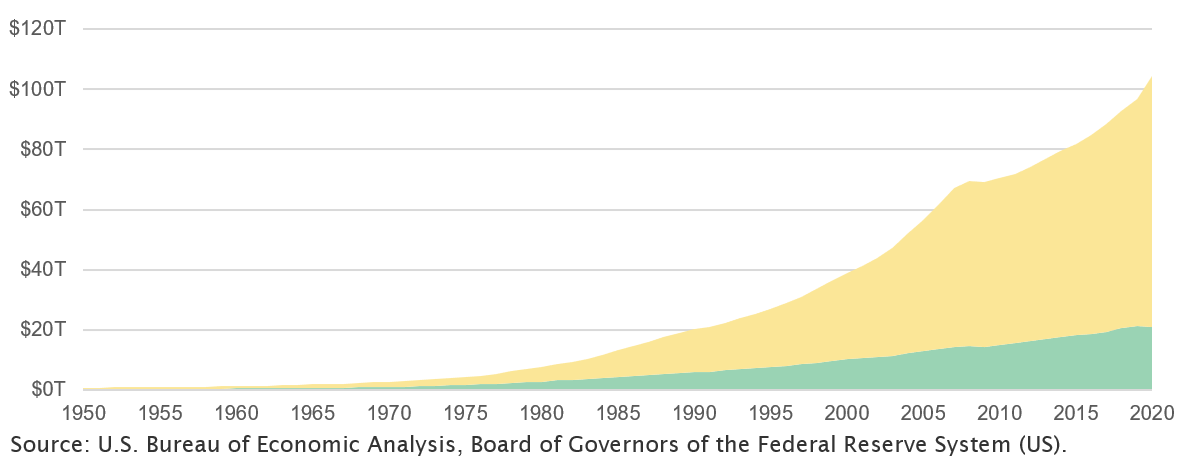
Figure 3: CAGR of Nominal GDP and Total Credit Market Debt Outstanding by Decade
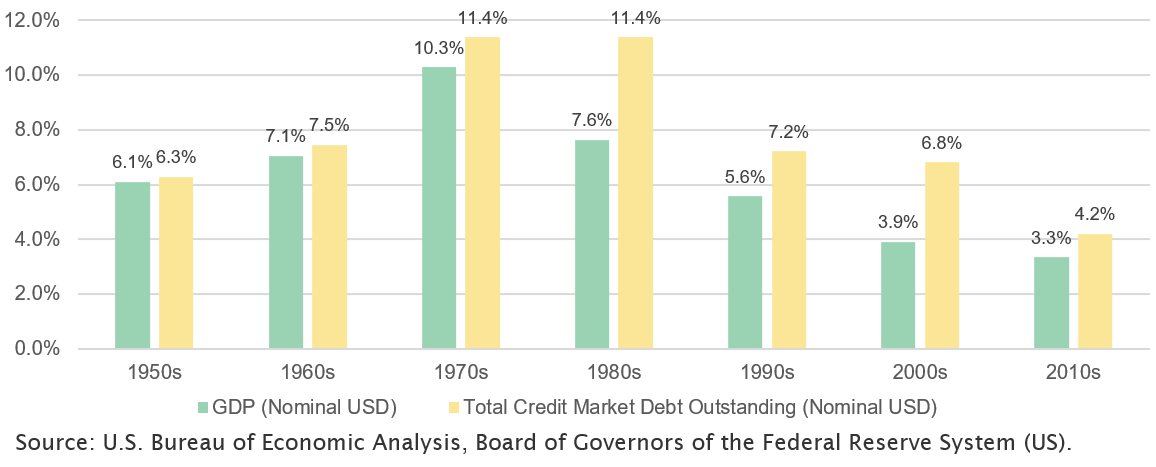
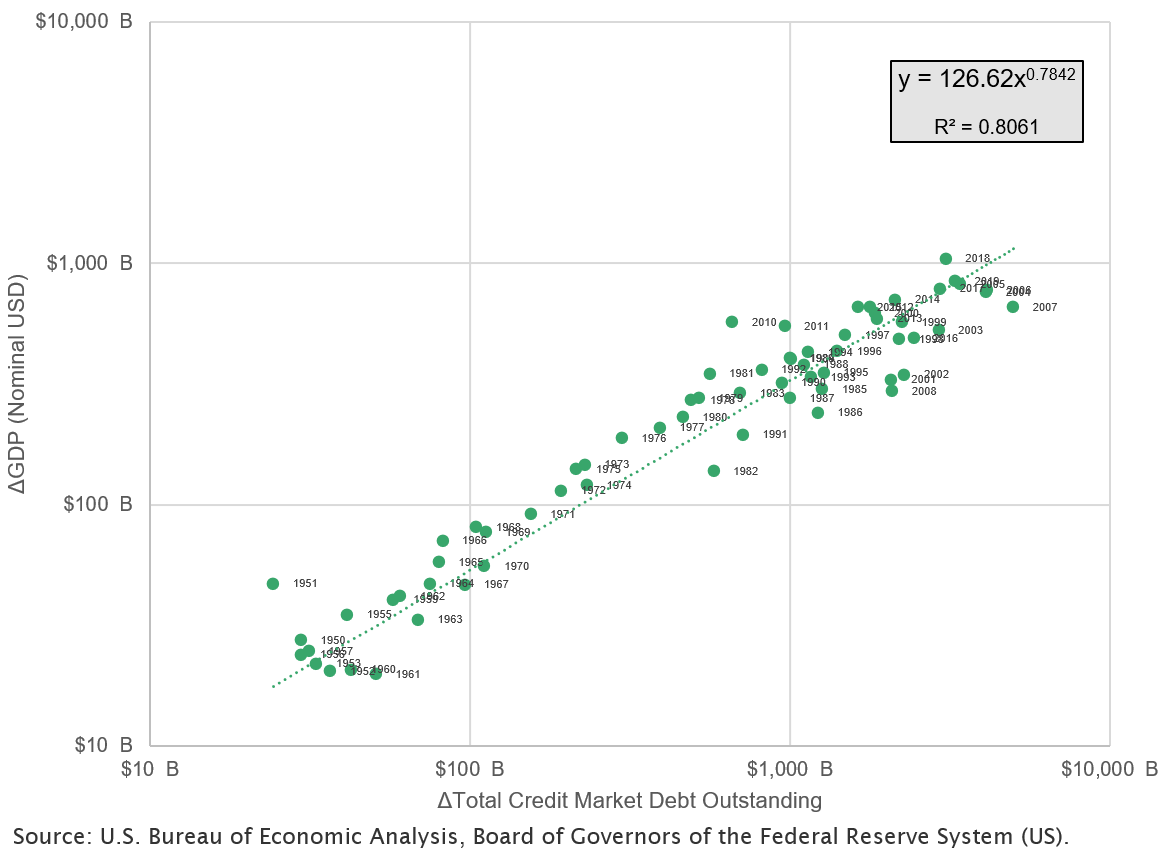
Figure 4: Annual Change in Nominal GDP vs Change in Total Credit Outstanding, Log Scale
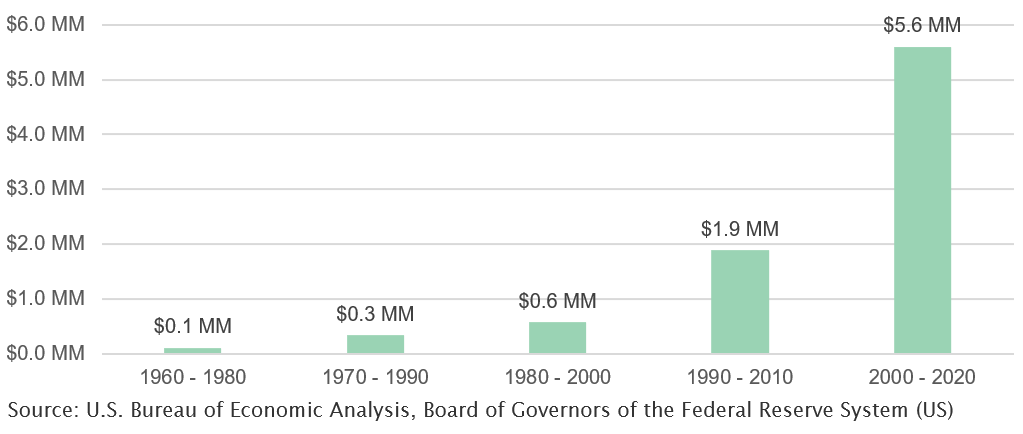
Why #3: The Marginal Productivity of Credit (ΔGDP) declines with increased use, like all inputs of production, pulling the Marginal Return to Lenders (Debt Service) down. As each decade passes, it requires incrementally more debt to generate one new dollar of GDP and one new job for an American worker.
Figure 5: Fitted Change in Nominal GDP vs Change in Total Credit Outstanding

Figure 6: Incremental Credit to Produce $1 Incremental GDP
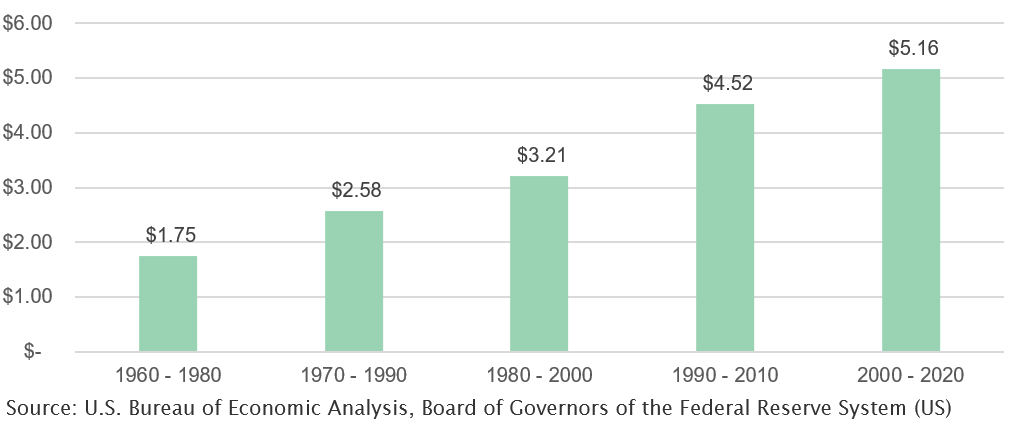
Figure 7: Incremental Credit to Produce 1 New Job
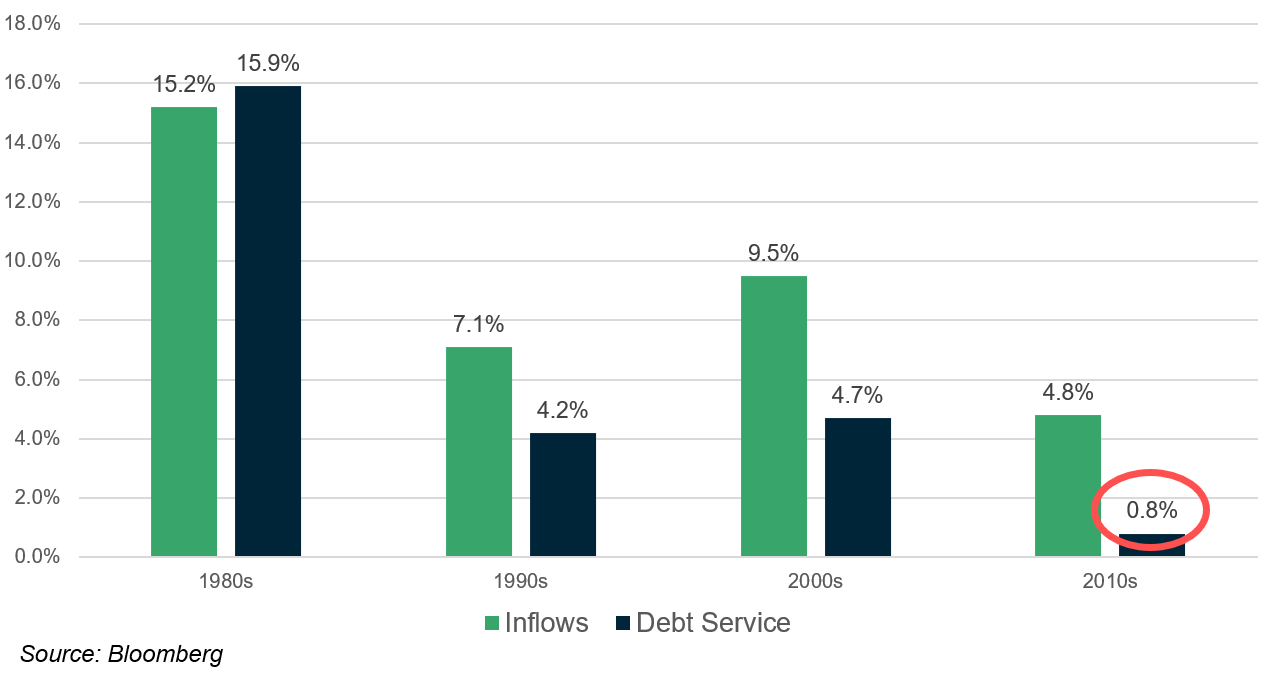
Why #4: The Marginal Return to Lenders (Δ Debt Service) trends towards its Marginal Cost (zero) at saturated equilibrium.
Figure 8: Bloomberg Barclays US Aggregate Index, Inflows vs Debt Service. Average Growth by Decade
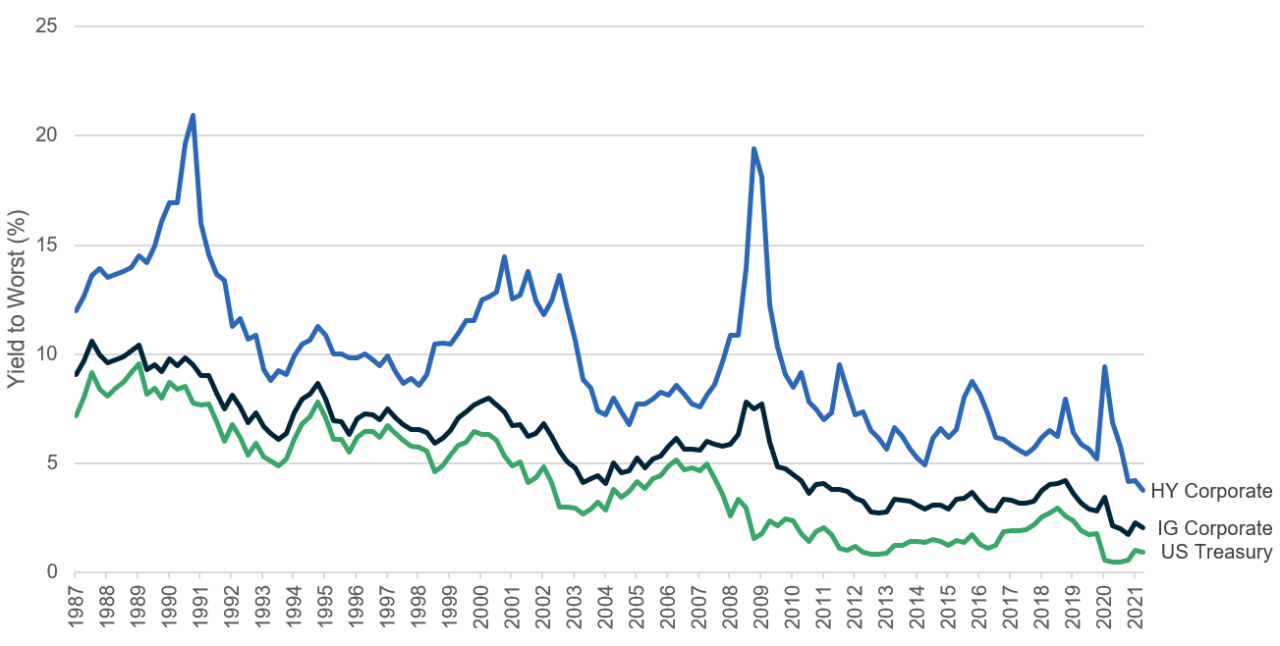
Why #5: Yields converge to zero as Debt Service growth stagnates, and Credit growth outpaces its associated change in output (GDP).
Figure 9: Yield to Worst Across Treasury, IG Corporate, and HY Corporate Debt
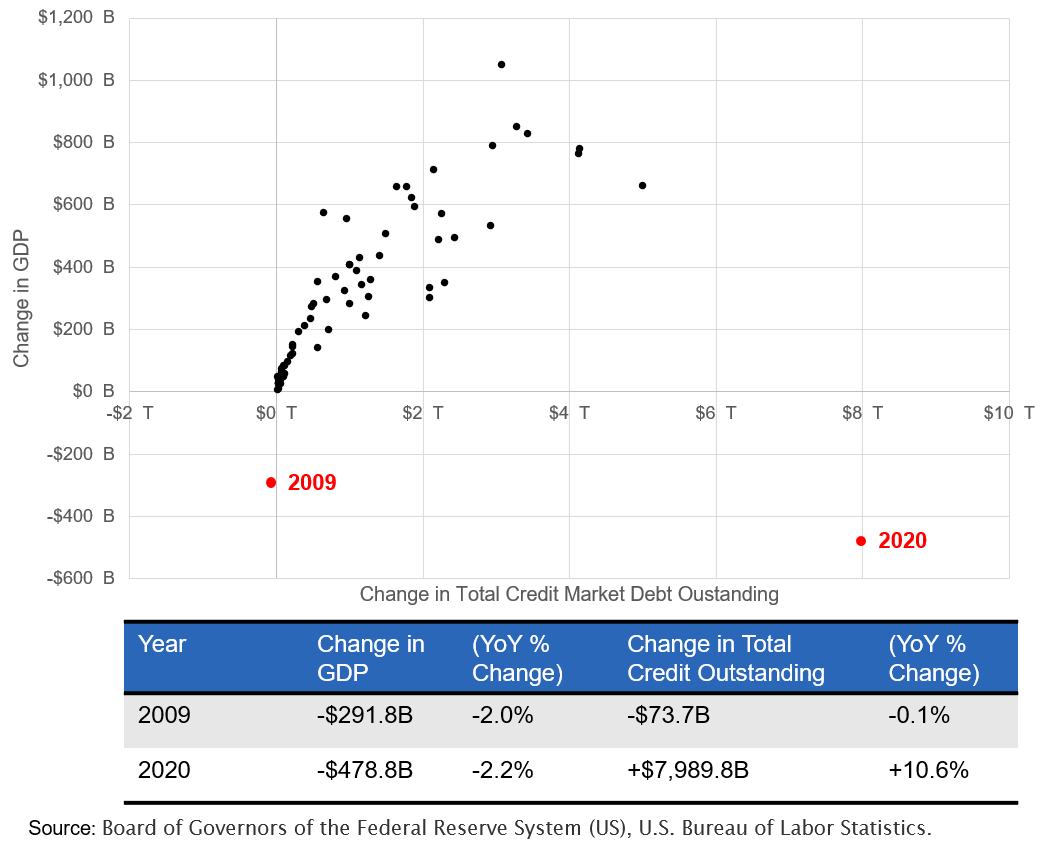
What’s Next: Were the Global Financial Crisis and COVID-19 pandemic merely warning shots of a continued trend?
The last two major economic crises both saw aggressive monetary policy responses, exacerbating the cycle of credit creation accelerating up and away from incremental gains in GDP. While we can’t predict the future, it is difficult for us to see how we escape this trap.
Global Financial Crisis
- Cause: credit destruction
- Symptom: output decline
- Exit strategy: accelerated credit creation
COVID-19
- Cause: global pandemic
- Symptom: output decline
- Exit strategy: accelerated credit creation
Next Crisis
- Cause: TBD
- Symptom: TBD
- Exit: TBD
Figure 10: Change in GDP vs Change in Total Credit Debt Outstanding
What can retirement-focused professionals do with fixed income to prepare for the decade ahead?
Even in the face of sustained inflation and marginally higher interest rates, we do not see evidence that the long-term trends we highlighted above will reverse course. Traditional fixed income strategies will not preserve or grow investor purchasing power. Existing bond strategies offer a limited set of tools that we believe are ill-equipped to handle a sustained zero interest rate and easy money environment. If you are considering any of the following four methods, you may want to reconsider:
- Reduce credit quality? You can reach for yield by allocating more to lower-credit-quality bonds, but you are taking on more credit risk in your portfolio.
- Shift into equities? You can simply shift fixed income allocations into equities and hope that the market goes up and to the right with no major corrections along the way. Sequence of return risk rears its ugly head in stock market corrections if you do this.
- Bond laddering? You can blend several bonds with different maturities, getting higher rates from the long-term bonds but still having liquidity from the short-term ones. However, the math is the same no matter how you slice the portfolio: you’re most likely taking on more duration than you’d like.
- Barbell approach? You can buy only short and long-duration bonds, but you still can’t get around the duration math problem.
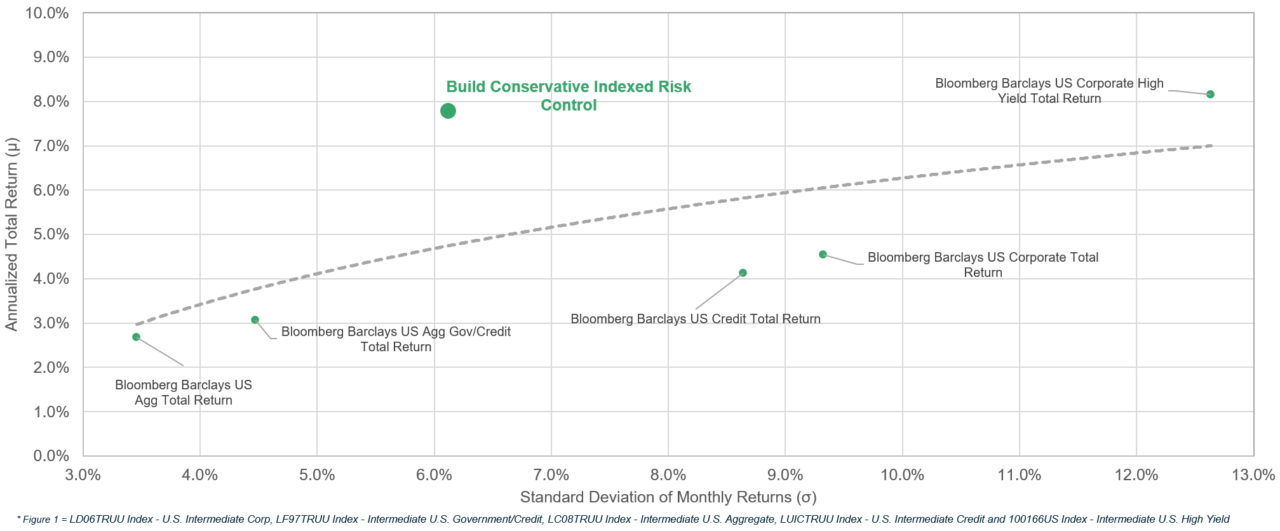
Now is the time to position your clients for the next era in fixed income investing. Build Asset Management’s innovative bond replacement strategy addresses changing market conditions and specifically, the low yield problem investors are facing. At Build, we’ve designed a new asset class seeking to address the problems outlined above: allowing fixed income investors to stay exposed to investment grade fixed income with intermediate duration, but still seeking upside. We call this asset class Indexed Risk Control, and it features:
- Fundamental active fixed income management
- Long only equity call options overlay
- Rules-based trading framework
Figure 11: Total Return vs Standard Deviation of Return, Annualized, Build vs Popular Bond Strategies
Click here to learn more about our flagship Conservative strategy: https://getbuilding.com/strategies/conservative/.