
Market Review
Though the tumultuous 2020 finally came to an end, its polarizing effects continued to be felt into early 2021. Meanwhile, the 46% surge in Bitcoin suggested the possibility of new, alternative return sources. The year’s macroeconomic data began with the first estimate of Q4 GDP coming in at 4%. The Fed’s preferred inflation target, the PCE Deflator, reported at a tepid 1.3%, well below the Fed’s desired target of sustained inflation above 2%. The December employment of 6.7% was marginally better than the estimate of 6.8%, but we had our first dip in the number of jobs since the major April 2020 losses, with nonfarm payrolls coming in -140k jobs. For most of January, equity markets were subdued, with VIX hitting a month low of 21.32 on January 21 before spiking to 37.21 on January 27 and then closing the month at 33.09. The S&P returned -1.11% for the month of January. In Fixed income, the focus was on the move higher in long-term rates and the yield curve’s shape. The 10-year yield moved from 0.91% on January 4 to 1.07% at month-end, and the 2-year/10-year slope of the Treasury curve was steepening from 79 basis points to 95 basis points at month-end. The Bloomberg Barclays Intermediate U.S. Government/Credit Index returned -0.28% for the month of January.
February saw a notable shift in the market’s expectation of inflation. Treasury Inflation-Protected Securities (TIPS), a reliable market indicator of expected inflations, saw real yields on the 10-year TIP move from a low -1.07% to -0.74% in February. Some market participants believed this move reflected a belief that the improved production, distribution, and rollout of COVID-19 vaccinations would lead to a pronounced improvement in the country’s economic performance. The unemployment rate, which continued to fall from 6.7% to 6.3% in February, reflected this optimism. And while there was a significant movement in TIPS, the January PCE Deflator (a lagging indicator) was tame, printing 1.5%. This low inflation indicator provided some comfort to investors who worried about the Fed being behind the curve concerning monetary policy. Equity markets were robust, with the S&P returning 2.61% during a month of moderate volatility and the VIX averaging 23.64. In addition to the increase in market expectations for inflation, yields on longer-dated securities continued to creep higher, with the 10-year Treasury moving 34 basis points higher to 1.41%. Similarly, the Treasury curve slope as measured by the 2-year/10-year slope steepened an additional 32 basis points to a level of 127. The Bloomberg Barclays U.S. Intermediate Government/Credit Index returned -0.82% for the month, reflecting these moves higher in yield.
While the first quarter provided bouts of volatility in both the stock and bond markets, one area that appeared to be a refuge of relative calm was corporate bond spreads. As measured by the Blomberg Barclays U.S. Aggregate Corporate Average Option Adjusted Spread, that indicator was marginally tighter at 91 basis points, five basis points lower from December 31, 2020. The relative tightness in spreads reflected both significant demand for corporate credit and a belief that the sector reflects solid credit fundamentals. However, throughout March, spreads ranged from a low of 90 basis points to a high of 100 as the market began to pick winners and losers associated with sustained economic recovery. Another interesting occurrence in March was the Federal Reserve’s release of its ‘Dot Plot’ graph that revealed more members expecting to begin increasing interest rates sooner than the-previously-stated “sometime in 2024”. While no interest rate hike is expected anytime soon, it was a notable change and reflected a belief that the economy is gaining momentum. Fed speakers qualified this upgraded view by stating there are significant risks to the expansion, and monetary policy changes are heavily contingent on the pace of recovery. Also noteworthy was the Fed’s lack of policy response to an important change in its outlook, something atypical from the Federal Reserve. Volatility in stocks remained subdued in March, with the VIX lower on the month, ending at 19.40, well below its 1-year average of 27.41. The lack of volatility reflected a strong month in stocks, with the S&P returning 4.24%. The move higher in yield continued in fixed income, with the 10-year Treasury ending the month at 1.74%, 33 basis points higher. The steeper Treasury curve remained in place, too, with the 2-year/10-year Treasury slope increasing to 158 basis points, 31 basis points steeper. The Bloomberg Barclays U.S. Intermediate Government/Credit Index returned –0.78% for the month of March.
Quarterly Performance
Strategy Performance as of March 31st, 2021 Market Close
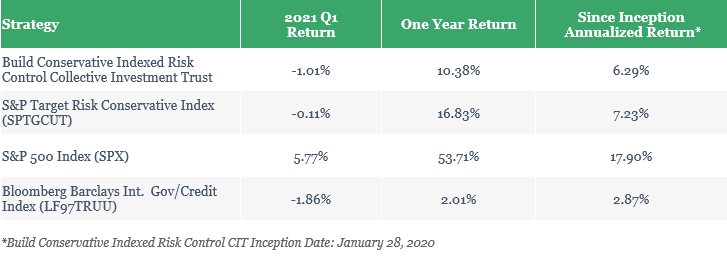
For the quarter ending on March 31st, 2021, the CIT returned -1.01%, net of fees. In comparison, the benchmark, the S&P Conservative Target Risk Control Total Return Index, returned -0.11% for the same period, for an excess return of -90 basis points. Since its inception, the CIT return was 6.29%, net of fees. In comparison, the benchmark, the S&P Conservative Target Risk Control Total Return Index, returned 7.23% for the same period, for an excess return of -94 basis points.
Performance Summary
With the above market review as a backdrop, the strategy’s primary driver of performance was the allocation to equity market exposure derived from the options overlay, contributing about 1.15% of the quarterly return. The equity options overlay ended the quarter with a 3.95% nominal weight of the portfolio. As the S&P gained steadily over the quarter, the long call positioning performed as designed. The fixed-income performance of roughly –2.16% contributed negatively to the quarterly return of the strategy. Note: Q1 2021 was the worst quarterly performance of the Bloomberg Barclays Aggregate Index since 1981.
The fixed income portfolio allocation contributed a negative total return to the overall portfolio due to rising rates. However, the core maintained its short duration position over the quarter, which benefited the portfolio on a relative basis, and closed out positions longer than 10 years and longer in maturity. The investment grade portion of the portfolio maintained its bias for up-in-credit, with an average credit quality of A+. Corporate spread movement was moderate, trading in a range of 11 bps over the quarter and ending nearly unchanged, but as noted above, subject to bouts of volatility. The key themes to the quarter were rising U.S. interest rates, with the 10-year rates higher by 82 basis points, the slope of the U.S. Treasury curve, which steepened 79 basis points, and the change inflation expectations as measured by the real yield of the 10-year TIP, which increased by 46 basis points.
In credit, industrial corporates generated 1.24% in excess return over U.S. treasuries during the first quarter, outpacing the financials that generated 0.36% excess returns over treasuries. Within industrials, “other industrials” and energy subsectors were top performers as a firming in economic growth expectations and commodity pricing provided tailwinds. Those sectors generated 4.50% and 2.06% in excess of treasuries, respectively, and the fund benefited from its allocations to those.
The fund also benefited from its allocation to asset-backed securities, as the overall securitized sector outperformed U.S. Treasuries.
Market Outlook
As we turned the page on 2020, there was hope that vaccines and therapeutics developed to help combat the coronavirus would push the economy forward. After some initial fits and starts, the vaccines’ rollout appears to be at or ahead of schedule. The pandemic’s medical response has translated to a buoyant equity market and contributed to a March 2021 Consumer Confidence indicator of 109.70 (1985=100), the highest reading since March of 2020. The Federal Open Market Committee of the Federal Reserve, which stated its intention to remain accommodative for the foreseeable future, acknowledged the economy’s growth at its March meeting by revising its 2021 growth target from 4.2% to 6.5% and changed its inflation projection from 1.8% to 2.4%. We expect the second quarter of 2021 to be robust and propel risk assets to higher levels for all these reasons.
Our outlook for the second quarter of 2021 is that the economic recovery will continue robustly, but the employment recovery will moderate. According to Bloomberg, the market’s current expectation for growth in Q2 is 7.0% on a quarter-over-quarter basis and a decline in the unemployment rate to 5.9%. We believe the risk to this forecast would be for faster economic growth but a moderating employment picture. As we expected at the end of the year, Biden and Congress delivered a $1.9T stimulus package. Build expects additional action by Congress, likely focused on infrastructure and project-based spending. However, unlike earlier stimulus programs, these more significant measures will likely be funded by increased taxes. With such a narrow majority in Congress, Democrats will find the road to more spending challenging.
In terms of impacts on markets, we do not expect any change in the Federal Reserve’s policy rate during the quarter. This forecast’s risk is that data will come in materially stronger than expected, forcing the Fed to act earlier than they have indicated. Currently, the front end of the interest rate curve is pegged by the lack of Fed policy action, and we have seen an increase in inflation expectations. This inaction results in upward pressure on the yield curve and an increase in real yields in the TIPS market. We believe this pressure to be moderate, and while 10-year rates could approach 2.00% throughout the quarter, we do not think moderate yield curve steepness will negatively impact the recovery. Additional Treasury supply at higher yields will be attractive to yield-starved buyers and be well absorbed.
With this market outlook in mind, the portfolio will maintain its short duration position relative to its benchmark, maintain a bias for higher credit quality and be positioned for a steeper yield curve. As our equity options overlay is driven by Build’s proprietary quantitative framework, the portfolio management team will apply the output of the model and be agnostic to equity market direction.